A sad day has dawned upon me as I have lost my access to a Bloomberg Terminal temporarily, so bear with me as I scavenge for screenshotted graphs and useful data.
If you have checked your day trading account, retirement account, or listened to the news, you may have noticed that the stock market has hit a bit of a rough patch in the past month and 2022 as a whole. Earlier last week, the S&P 500 was down 20% from its highs set in December, placing it in bear market territory (Figure 1).
Figure 1: S&P Drawdowns Since 1900
The main perpetrator of this sell-off has been the lofty valuation multiples (P/E, EV/EBITDA, etc.) that equities received after two years of stimulus. In the low interest rate environment that took place in reaction to the pandemic, risk asset values soared. Investors were “pushed” into riskier assets, such as high beta stocks, to get higher returns than near-zero yielding safe government bonds. This pushed multiples higher. However, as interest rates have rapidly risen in 2022, these valuations have come back down to Earth (Figure 2).
Figure 2: S&P 500 Price to Earnings and the U.S. 10 Year
This type of multiple compression was seen at a more drastic scale for tech stocks during the popping of the Dotcom Bubble (Figure 3). Like the Dotcom Bubble, we see multiples compress before earnings fall. With markets being forward-looking entities, are growth stock multiples fully priced to reflect a decrease in earnings, or will there be further pain as earnings decrease? If they aren’t fully priced in, how will the markets react when earnings actually get bad like those seen during previous recessions?
Figure 3: U.S. Tech Stocks’ Price and Earnings Now Compared to Dotcom Bubble
Despite the drastic compression in multiples seen in the past couple of weeks, there may still be some room on the downside. During the hangover of the Dotcom Bubble, the P/E for S&P companies fell to ~-7x below the historic 5-year moving average (Figure 4). While the S&P 500 is already -2x below its 5-year moving average, there may still be room for further compression. It is unlikely to see compression to the same degree as the Dotcom Bubble, but still enough for the S&P 500 to further decline on a multiple basis.
Figure 4: S&P 500 P/E Minus 5-Year Moving Average
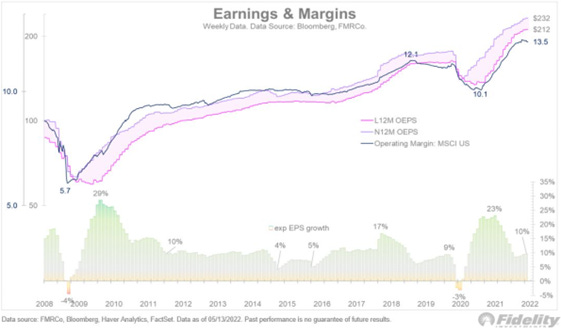
The other main driver that determines the S&P’s value is earnings. Earnings are still expected to increase by around 10% next year because of this lagged effect of interest rates (Figure 5). However, margins have started to show signs of compressing due to higher inflation and exceptionally high readings of the PPI as companies’ input costs rise faster than the price of the goods they sell. Even though companies may be beating earnings estimates, margins become more critical in inflationary environments.
Figure 5: Earnings Set to Increase as Margins Get Squeezed
Retail sales can be seen as an example of inflation’s effect on earnings (Figure 6). On paper, what is reported in earnings filings, retail sales have increased heavily in 2022. However, using 2019 price levels, real retail sales appeared to have peaked in the first half of 2021.
Figure 6: Inflation-Adjusted Retail Sales
These inflationary pressures have started to eat into traditional retailers like Walmart (Figure 7). Consumer staple (CS) stocks, including Walmart, are thought to be safe places to hide out during equity sell-offs. Before May, CS stocks were able to fend off the sell-off that plagued the rest of the S&P 500. However, several value retailers like Walmart and Target reported disappointing Q1 earnings, citing inflation driven by higher transportation costs from fuel and employment costs (CNBC).
Figure 7: Walmart Getting Beaten By Inflation
Overall, this has been the worst return of the S&P 500 during an earnings season by a wide margin in the past decade (Figure 8). While there have been many other macro factors at play, saying it is occurring amid a -20% S&P drawdown, this is a sign of investors starting to price in worsening future earnings likely due to rising recession risks.
Figure 8: Average Weekly S&P 500 Return In Earnings Seasons
Growth stocks have been one of the worst areas hit by this equity sell-off. The last time growth stocks were this overvalued compared to value stocks was during the Dotcom Bubble. The growth to value ratio has significantly decreased from its peak but still has a way to return to the historical mean.
Figure 9: Growth to Value Stock Ratio
This overvaluation of growth stocks compared to value stocks was a symptom of a low interest rate environment. This relationship between the growth to value stock rotation and interest rates can also be seen through the high to low beta (essentially the same thing as growth stocks, which have a higher beta due to their increased risk) and the 2-year change in the 10 year advanced by 18 months (Figure 10). The effects of interest rates historically appear to be strong on the high to low beta ratio. The rapid increase in the 10 year in 2022 shows that high beta stocks are in for a rough couple of months.
Figure 10: High vs. Low Beta Stocks with the 2-Year Change in the 10 Year Advanced by 18 Months
Speculation levels in the options market have also settled. Put option open interest, which is used to hedge falling security prices, has outpaced call option open interest, which pays off when a security’s value rises above the strike price. Many day-traders used call options as a speculative tool in the past two years to leverage their positions. However, the wind has sharply shifted as investors use more put options to hedge against falling equity values.
Figure 11: Put to Call Option Ratio Means Portfolios are Bracing for Choppy Waters
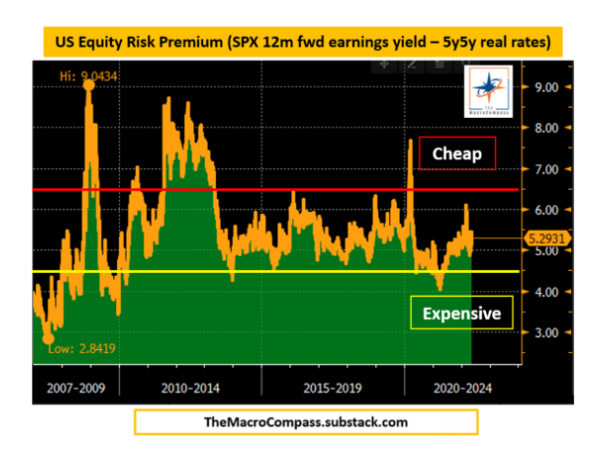
Finally, this was stolen from another substack; even though the carnage in the equity market has been brutal there is still room to fall. Looking at equity risk premium, which is calculated by subtracting real yields from equity earning yields, equities still haven’t reached the historically cheap level (Figure 12). With the Fed put a non-existent option for the equity market, the idea that the Fed will step in to save markets as they have in the past two decades seems to be far-fetched in an inflationary environment. The Fed is focused on controlling inflation, especially being able to produce results before the midterm elections in November.


