Behind China's Wall of Debt
The History Behind China's Massive Debt Growth and What Could Be Next
“I said that we needed to shift the focus to improving the quality and returns of economic growth, to promoting sustained and healthy economic development, and to pursuing genuine, rather than inflated, GDP growth and achieving high-quality, efficient, and sustainable development”- Xi Jinping, President of the People’s Republic of China.
While China has excelled over the past decades, many economists are now predicting that several headwinds will affect the country’s overall growth rate. The most prominent indicator is a large amount of debt invested in non-productive assets like infrastructure and real estate. This article aims to explore the reasons behind China’s explosion in growth, how it has been pushed to a level that is difficult to maintain, and how the country needs to transition and deleverage to produce real growth.
Building the Rocket
Before the late 1970s, China was worn down from several conflicts, such as the second Sino-Japanese war and its civil war. More so, the nature of Mao Zedong’s leadership required most enterprises to be nationalized. While this provided stable pay and suitable living conditions, it offered little incentive for workers to innovate and grow the economy. Additionally, China was isolated before the 1970s, allowing for a minuscule amount of knowledge, technology, or investment from the outside world. Due to these reasons, the country was considered very poor during the time (Figure 1).
Figure 1: China’s Historical GDP Per Capita

The spark for change came when Mao Zedong passed in 1976, and two years later, Deng Xiaoping won leadership. He immediately recognized the need for reform and installed several open-door policies to achieve a socialist market economy. Michael Pettis, a finance professor at the Guanghua school of management at Peking University specializing in Chinese financial markets, summarizes the strategy quite well. He states that the act of enforcing liberalizing reforms allowed for the creation of social capital. It is important to spend some time on this term. The World Bank defines social capital as:
“Social capital refers to the institutions, relationships, and norms that shape the quality and quantity of a society's social interactions. Increasing evidence shows that social cohesion is critical for societies to prosper economically and for development to be sustainable. Social capital is not just the sum of the institutions which underpin a society – it is the glue that holds them together”.
Pettis explains the term in a broader sense; for instance, he discusses the model of social capital and how it states there is an appropriate level of capital stock (investments) per worker that is contingent upon the worker and businesses’ ability to absorb the additional capital stock. While this is slightly confusing, it is simplified to say that an economy’s framework must encourage the ability for it to absorb more productive investments. The higher social capital is, the more prosperous a country can become from natural growth. Ultimately, it comes down to having the right institutions and leaders to implement this structure. Pettis explains that the framework of social capital should accomplish three things:
Create incentives and rewards for innovation that is defendable through legal action.
Encourage the creation of business ventures and phase out older, less efficient operations.
Maximize participation in the economy by the whole population while minimizing variability in that participation.
Looking at this list, one can derive that the first two imperatives enforce the third. Suppose this framework of social capital is accomplished. In that case, there is an incentive to innovate and be competitive, which leads to new business ventures, and therefore, a higher participation rate in the economy. To Pettis, social capital is not just the social norms but the entire legal, institutional, and economic system along with the relationship between them that allows the economy to absorb more capital investments and drive productivity growth.
Returning to the topic of China, it can be argued that Deng’s reforms in 1978 built the social capital needed to help the country advance. They relieved the constraints and opened the door for China to improve its trade and learn from the outside world. The country boosted productivity by incentivizing the creation of businesses, which created abundant wealth for the population. For instance, during this time, citizens could produce and sell products by themselves without state-controlled interference. However, it wasn’t long before this growth began to push on the walls of what the economy was capable of.
China quickly realized the lack of capital investment disallowed physical capital to catch up with the already established social capital (as discussed earlier). To increase its infrastructure and capacity to grow, Deng instituted what many believe to be an economic development model that was founded by an economist named Alexander Gerschenkron. The Gerschenkron model was developed to describe the growth seen in Europe throughout the 1930s and in the Soviet Union post the second world war. It discusses how countries poised to grow through industrialization start as relatively backward and in need of investment. The backwardness of the economy refers to lacking the necessary resources to develop and industrialize. These items can consist of: insufficient capital, labor, technology, and political stability for the country to organize and expand. One of the essential items on the list for China was the need for physical capital. While investments to develop these assets can be obtained from multiple sources, for instance, foreign investors, the Gerschenkron model recognized that that path was risky and left the country vulnerable to large capital outflows and economic changes in the investor’s homeland. The safer route, which the government of China proceeded with, is to raise savings rates for corporations and elite individuals who would then invest in the economy. More specifically, the government realized that household income growth led to higher consumption and lower savings rates, diminishing domestic investment. By constraining household income, consumption fell, and savings rose. The government then saw that the private sector was skeptical about investing in the needed productive ventures as the country was still relatively undeveloped and risky to fund. In turn, central authorities allocated savings by identifying productive investments and projects, which was relatively easy due to the considerable lack of physical, advantageous assets. This led to the household and corporations’ savings rates to increase during the early 1990s and 2000s, which they then used to invest and grow, as shown in Figure 2.
Figure 2: China’s National Savings Rate (as a Percent of GDP)

While instituting the Gerschenkron model helped China achieve physical capital equivalent to their social capital, there is still an essential part of the growth story that needs to be addressed: demographics.
Adding Fuel
China’s people play a crucial role in its ability to grow. As mentioned at the beginning of the article, before the 1970s, China had several conflicts that hurt its population base. In 1949 Mao Zedong encouraged the citizens to reproduce to restore manpower. This sparked a baby boom where the population grew massively. It became so large that the government began to stress over the number of children and if the people would be able to care for them. A mismatch developed where the number of children added to the growing population; however, they were not working or producing anything, only consuming and draining the country, which put the food supply at risk. For instance, from 1959 to 1961, the Great Chinese Famine killed an estimated 15 to 30 million people, leading to the government’s action to curb population growth. Central authorities began to push for fewer births which worked as the population slowed from 1970 to 1976. However, it leveled off with no movements until the government instituted the famous one-child policy in 1979, which limited couples’ ability to reproduce more than once. Figure 3 displays the effect the policies had on China’s birth rate.
Figure 3: China’s Birth Rate
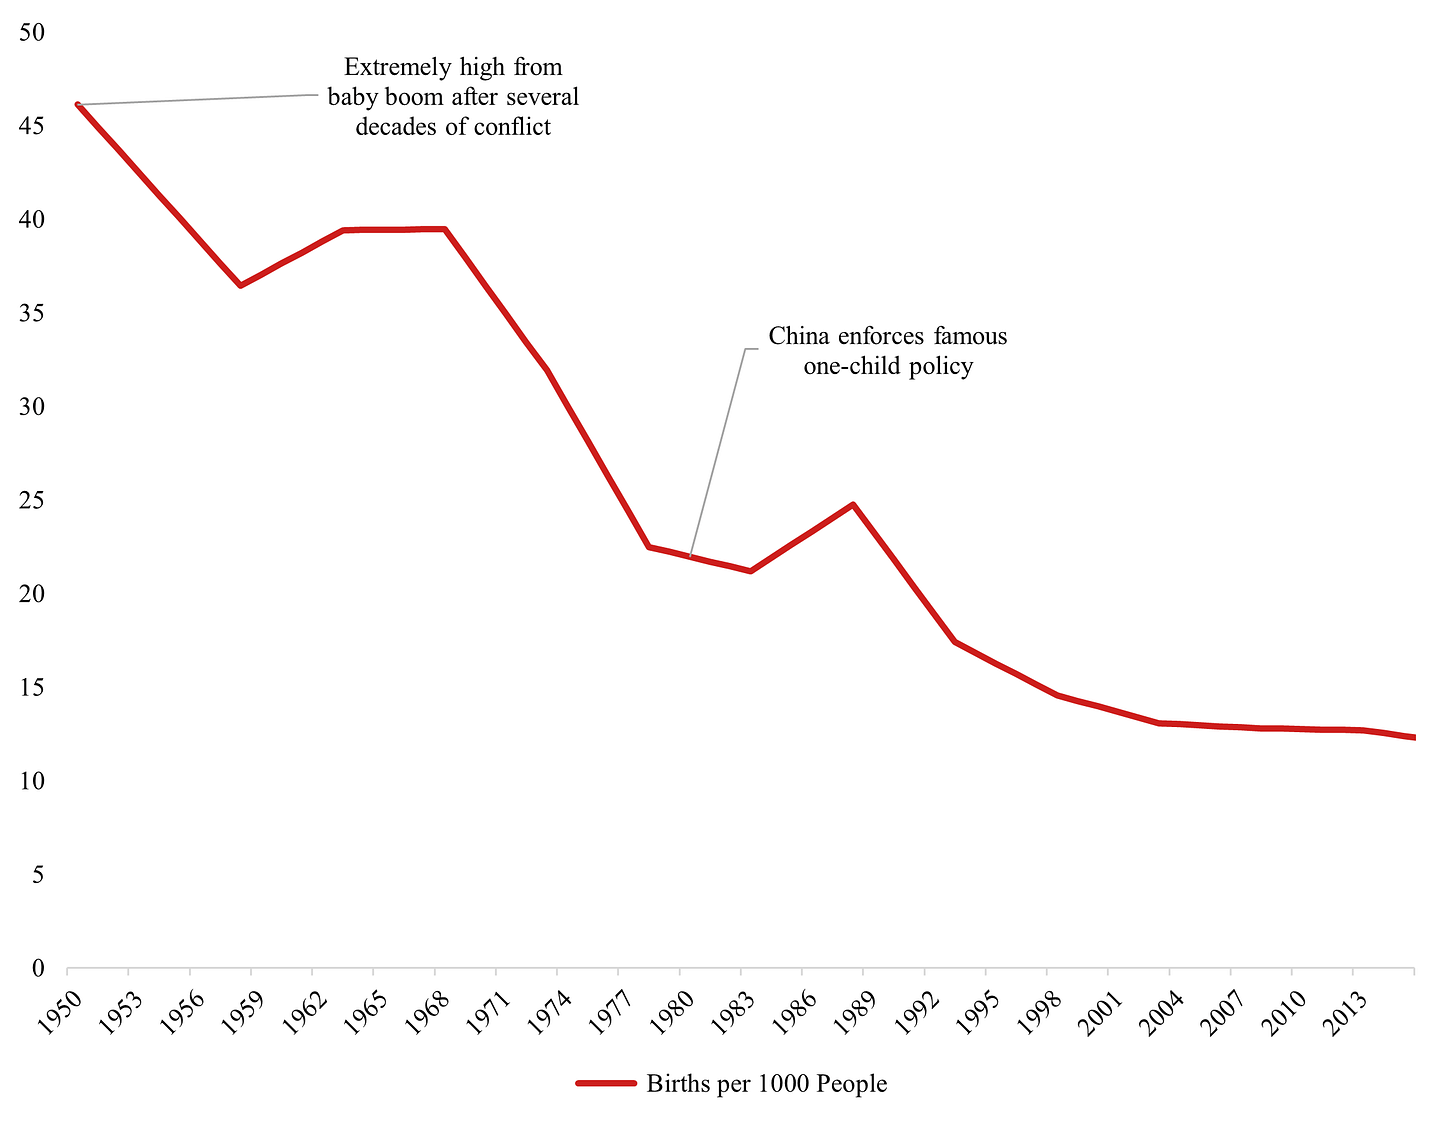
While slowing the birth rate will most likely hurt China’s growth in the future (discussed later), the fact of the matter was that the population had still grown to be massive. More so, it was full of youth that would age into the working population precisely when Deng took over, instituted reforms, and adopted the Gerschenkron model to grow social and physical capital (as discussed earlier). This led to a perfect storm where China’s working population grew in line with positive structural changes. Figures 4 and 5 display its peak throughout the 1990s and 2000s.
Figure 4: China’s Population by Age Group
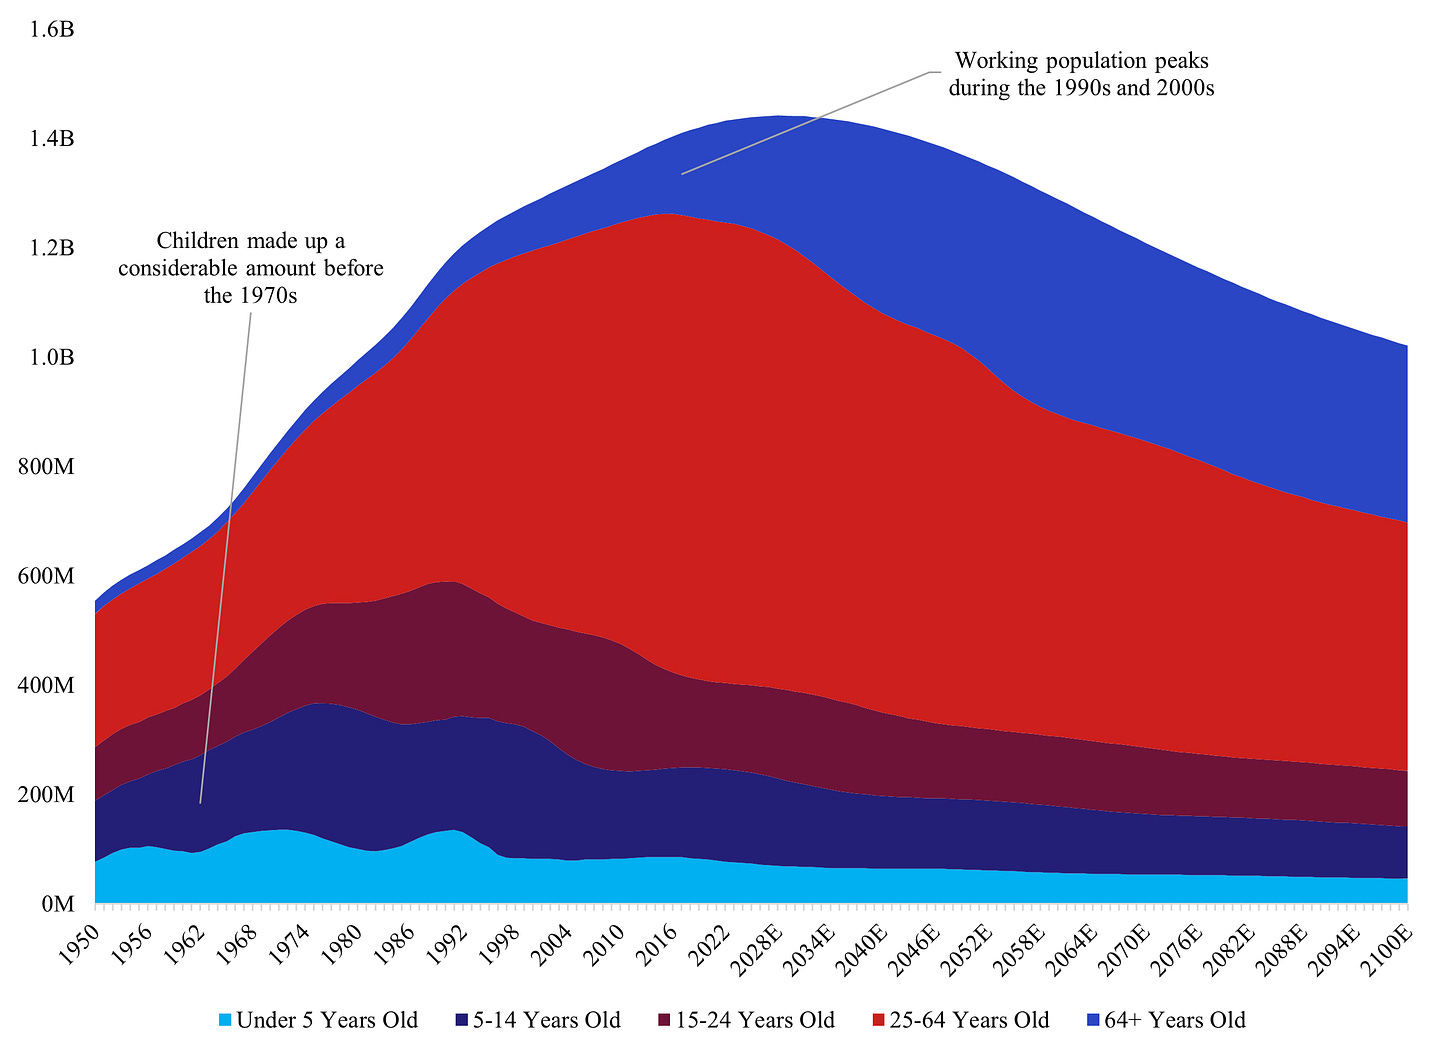
Figure 5: China’s Working Population

Take Off!
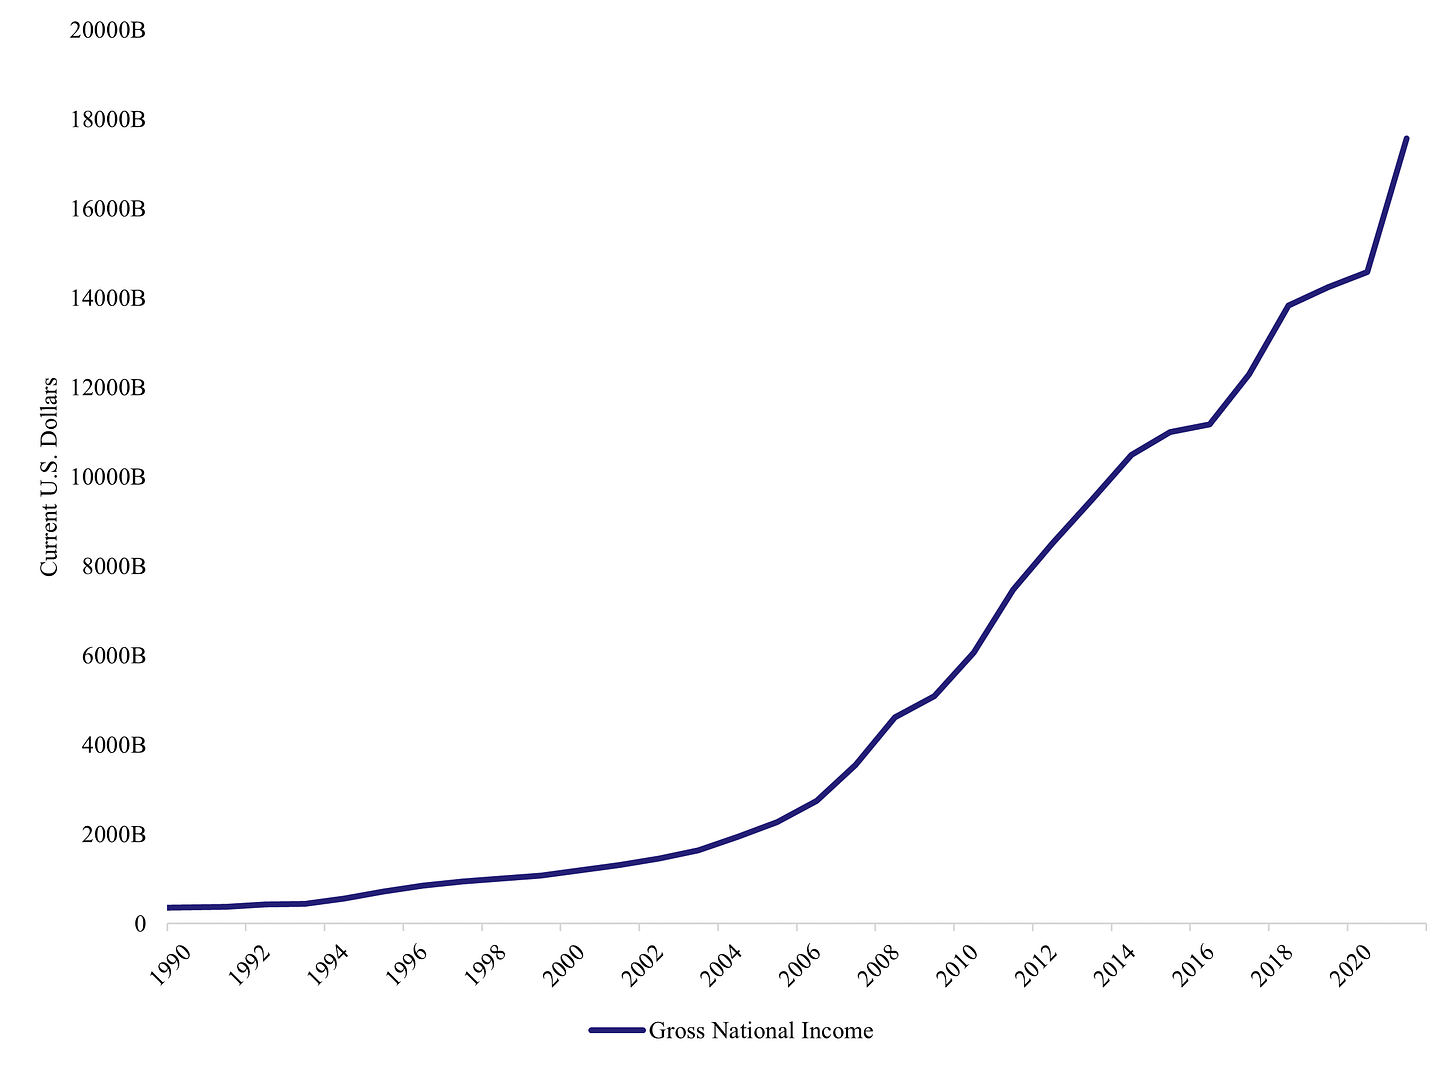
The combination of reforms, central authorities investing in productive assets, and the labor force coming to age set off an explosion of economic growth within China. The country accelerated its prosperity through the model of transferring savings to investments. It should be noted that the distribution of this newfound wealth was skewed toward the rich and businesses due to the model’s structure of constraining household income growth for workers. However, income grew at such a rate that all Chinese citizens benefited from the expansion, as shown in Figure 6.
Figure 6: China’s Gross National Income
One of the most important events during China’s ascension was its admission into the World Trade Organization (WTO) in 2001. Central authorities saw the trade group as an opportunity to continue to drive change within the country. To meet WTO requirements, further reforms took place that improved both legislative and regulatory requirements. More so, China refined its laws surrounding copyrights, patents, and trademarks while overhauling national economic institutions. Many of the reforms lead back to Pettis’s social capital discussion and how the creation of these organizations allowed for further incentivization of innovation and investment.
WTO also allowed China to join an organization built to provide more structure and regulations in the global trade industry. That, combined with the advancement of transport logistics, communications technology, and the emergence of global value chains, allowed for an environment where China’s export business would thrive. By 2010 China was already the world leader in exports surpassing the U.S. and Germany, as shown in Figure 7.
Figure 7: Share of Global Exports

China continued to grow from 2000 to 2010, pushed by its structural and genuine growth factors. However, as China’s physical capital converged with its ability to absorb it (social capital), the room and opportunity for real wealth and productive investments peaked, which left the country to turn to more cyclical solutions to keep growth rising.
Going Too Far
By 2010, signs of China’s demographics were already showing signs of stagnating. For instance, if one glances at Figure 5 again, it can be seen that the working population peaks at around 70 percent and then begins to fall rapidly. It displayed a significant signal that the fuel that pushed the machine started running out. More so, in comparing China’s population by age to other countries like the Euro Area and the U.S., it can be seen that China is forecasted to be at a considerable disadvantage regarding demographics and the working population. This is most likely due to the implementation of the one-child policy. Please compare Figure 4 with Figures 8 and 9 to see the analysis.
Figure 8: Euro Area’s Population by Age Group:

Figure 9: U.S. Population by Age Group:

While Europe is expected to have a working population that slowly decreases over the next 80 years, the rate at which it is declining is nowhere near as steep as in China. On the other hand, the U.S. is scheduled to steadily increase its working population over time, leaving China the worst out of the group.
China’s productivity was stagnating as well. Figure 10 displays China’s total factor productivity, a measure of an economy's changes over time regarding inputs such as capital and labor. While the country had a massive spike between 2003 and 2011 (over 22 percent), one can observe it slowing as 2010 passed.
Figure 10: China’s Total Factor Productivity

With demographics and productivity leveling, China realized it had to act to keep the growth train running. To do so, a massive amount of cyclical credit expansion was used over the last decade. Figure 11 compares China’s non-financial sector debt as a percent of GDP to the U.S. and Europe. It took China only ten years to lever the economy, whereas Europe and the U.S. took about 30 to 40 years to accomplish the same expansion.
Figure 11: Non-Financial Sector Debt as a Percent of GDP
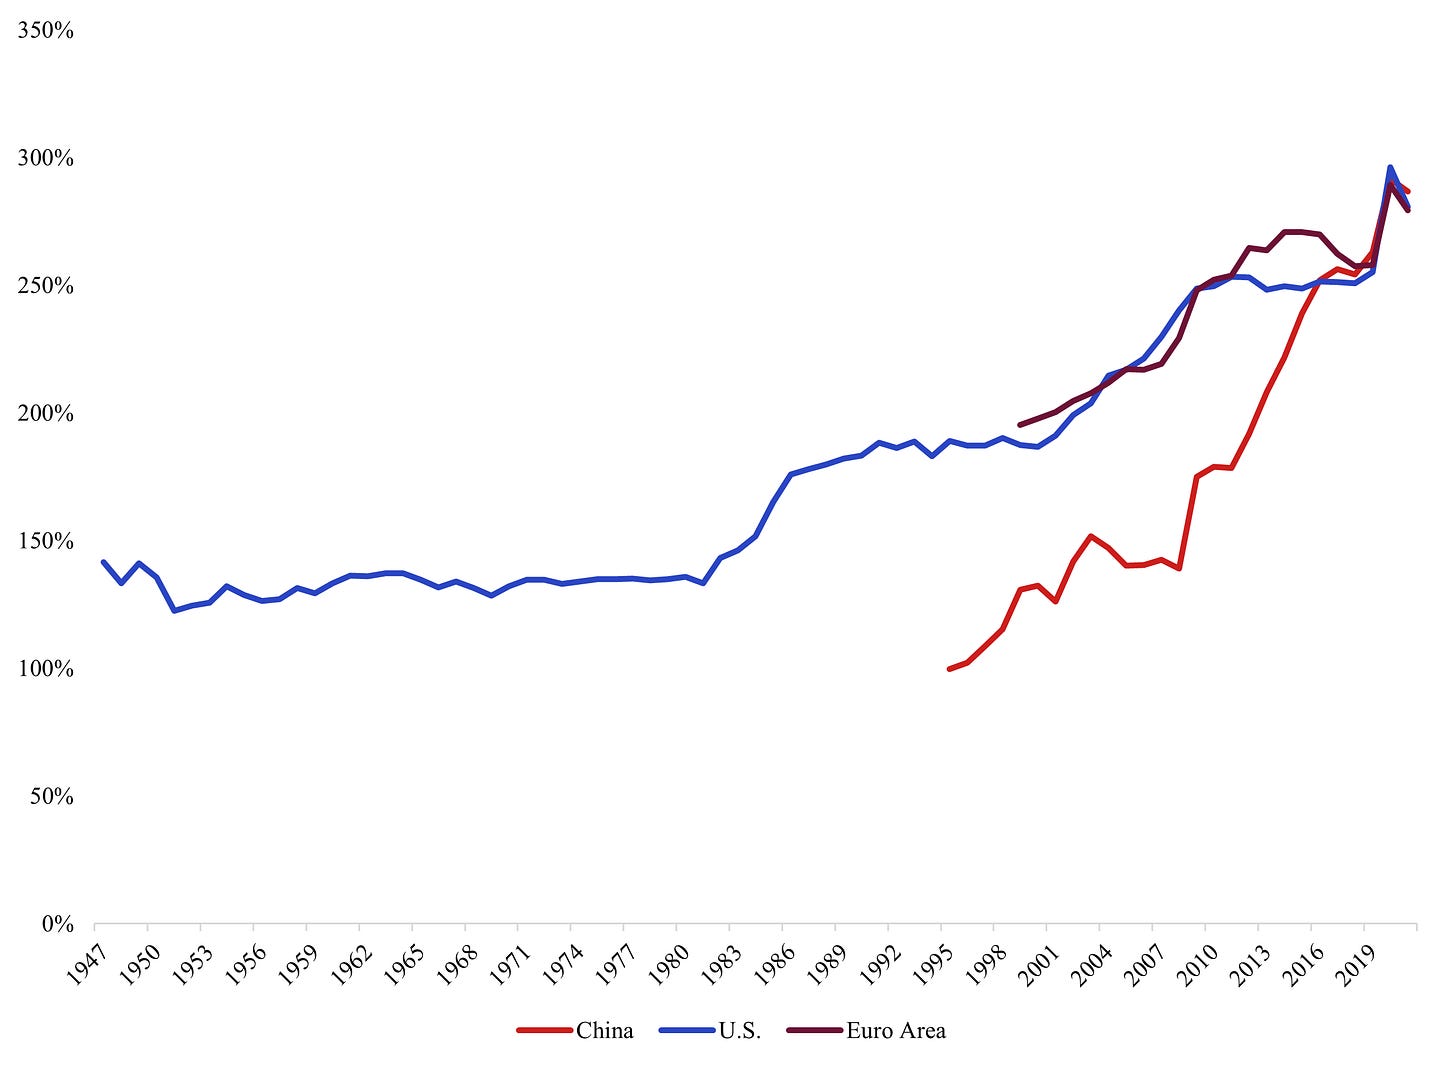
It should be noted that debt is not necessarily bad as long as it contributes to productive investments that will create real growth higher than the cost. It can be thought of like this: the effective use of debt is an increase in the economy’s debt-servicing capacity (GDP can be used as a proxy) that is larger than the increase in the debt servicing costs. This was the situation within China till the mid-2000s. However, even though real investments began to dry up, China’s central authorities kept using their ability to create and direct credit to whichever area of their choosing through what is called: credit window guidance. This allows a central bank to impose a bank credit growth quota for commercial banks. That forced debt creation to flow into corporates and households (Figure 12) that levered up during the credit expansion and ultimately contributed to investing in non-productive assets that gave the illusion of natural growth. To return the use of debt, in this situation, it should be thought of like this: non-productive assets increase the economy’s debt servicing capacity (still using GDP as a proxy); however, it is now smaller than the increase in the debt servicing costs as these investments turn out to be worth less than initially thought.
Figure 12: China’s Debt Split by Sector (as a Percent of GDP)

Most of the non-productive investments were focused on areas such as real estate and infrastructure. The piling on of credit led to high investment rates and asset price bubbles within these sectors. For instance, in 2018, real estate investment reached eight percent of China’s GDP, as shown in Figure 13.
Figure 13: China’s Real Estate Investment (In USD and as a Percent of GDP)

Popularity in real estate has also boosted the construction industry, which benefited from the increase in building; by 2016, real estate and construction combined for around 29% of China’s GDP. This growth quickly attracted the financial sector as bank lending is the primary source of real estate funding; by the fourth quarter of 2018, real estate loans accounted for about 28% of all outstanding loans and 40% of the new loans being issued. All this funding caused the real estate market to appreciate immensely and attracted higher valuations due to initial capital gains and extrapolations that the asset prices could only go up. The housing market quickly became a way to invest money with the expectation of ample returns - so much so that housing accounts for 78 percent of all assets in China (including stocks, bonds, etc.) compared to 35 percent in the U.S (Figure 14). These investments have caused Chinese households to lever up quickly (Figure 15).
Figure 14: Different Asset Class Valuations in 2017

Figure 15: Household Leverage Ratio by Country
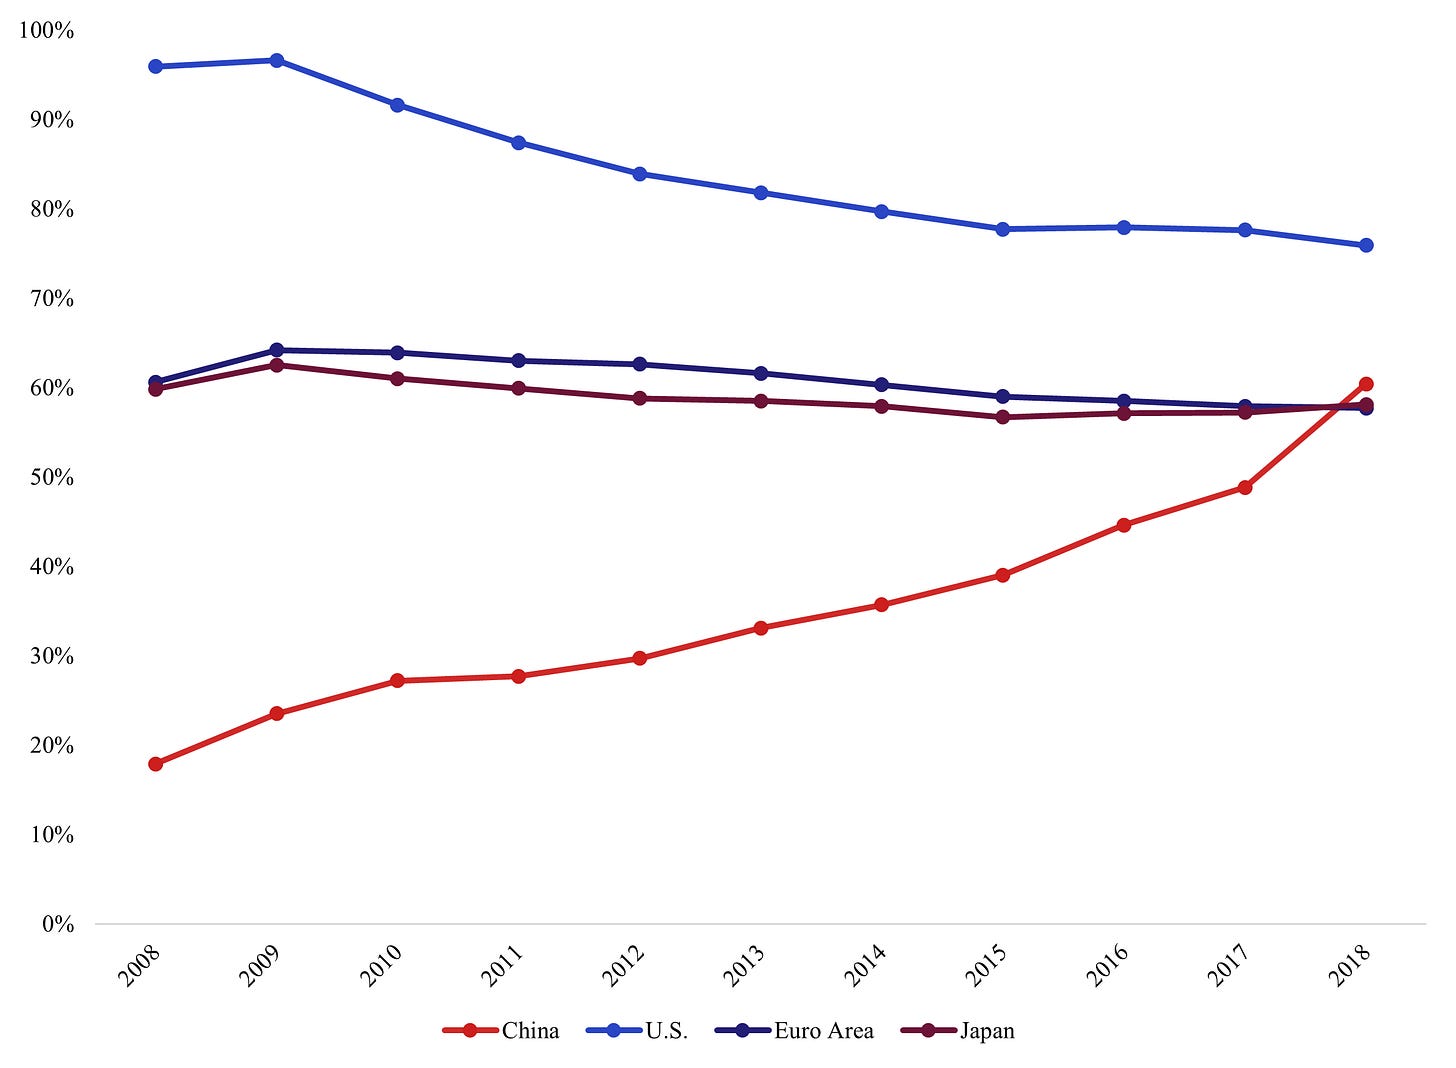
The high leverage in housing and corporations, along with unprecedented asset price appreciation in real estate (and other sectors), has put China at risk and makes for what many economists call an unsustainable growth model. China's central authorities have recognized the threats of high leverage and have vowed to reform and crack down on the reliance on debt for growth. For instance, regulators implemented what became known as “the three red lines” for property developers. These consist of stringent limits on a company’s debt-to-asset, debt-to-equity, and cash-to-short-term debt ratios. These red lines have already affected the real estate market and large developer companies like Evergrande by making it harder for them to access credit, forcing them to pay down debt, liquidate assets, and, in some cases, default.
Returning Safely to Earth
While China has stated its attempts to reverse its course from using the pro-cyclical, debt-heavy model for growth, it still has a lot of change to implement. Pettis argues that growth can only be achieved through investment, consumption, or trade surplus. He breaks each of these options down with different paths China can take (more on that here). To simplify, China has already invested heavily in its economy, and it is what is causing most of the issues. If it were to attempt to reallocate funds into more productive investments, say in the technology sector, it might find that area of the economy unable to accommodate the large inflows. For instance, China currently invests 40 to 45 percent of GDP annually, with around 60 percent split evenly between infrastructure and real estate investment. On the other hand, the technology sector only makes up 10 percent of GDP, making it very difficult to absorb the transfer. More so, there is already plenty of capital chasing high-flying technology ventures, and inflow may cause another bubble and result in more non-productive investments.
As for China’s trade surplus, it is already at around four to five percent and makes up nearly one percent of the rest of the world. For it to increase further seems unlikely for a country of its size as the world most likely could not support the demand needed to sustain this path. That leaves consumption as the only option, which may be the right one when only looking at the numbers. For instance, China’s household consumption only makes up about 38 percent of GDP and is historically low compared to other countries, as shown in Figure 16.
Figure 16: China’s Household Income (as a Percent of GDP)

The reason household consumption is so low is due to household income being strangled from the current model of high savings being invested by elites and corporations. If China reallocates and increases income, the economy could switch its development model from investment-driven to being powered by domestic consumption. However, for this to happen, households must achieve a higher income by keeping more of what they produce. This means a higher share of GDP will have to be allocated away from either business or the government. As companies in China obtain roughly the same percentage of GDP as other countries and would be less willing to transfer it to households, it will most likely have to come from local governments.
The challenge is getting local governments to step away from the high savings and investment model and transition to giving more to households to increase demand. This issue will likely be heavily debated between the central authorities and the local governments in the coming years. For instance, in 2007, then-Premier Wen Jiabao stated that rebalancing domestic demand toward consumption was a top priority for China’s economy. If one glances back at Figure 16, it can be seen that it has been a challenging goal.
The overall issue again comes back to Pettis’s discussion of social capital. China’s current model is built around institutions, laws, and regulations that enforce and benefit governments, corporations, and elites who adhere to high savings and investments. New social capital must be implemented for China to switch to another model based on demand driven by consumption. This is where the issue begins to raise its head. First, it is incredibly difficult to create new social capital and institutions that support a new structure. Second, the groups profiting from the current model have amassed a large amount of political power, which means they may look to block change as the cost of adjusting will most likely fall on them. While the demand-driven path makes sense in numbers, the political consequences could make it challenging to execute.
If China cannot replace these non-productive investments and the artificial growth they create, it is most likely that a contraction will be seen. There are usually two ways that this event can happen. One is a significant drawdown, such as the U.S. in the early 1930s, which is harmful in the short-term but tends to be more beneficial for the economy in the long-term (permitting political or social conflicts does not make things worse) as debts are restructured, and reform is forced into place. Another option is smaller drawdowns that result in stagnant, low growth rates, such as Japan after the 1990s. Pettis argues that if the country cannot pivot, the most likely occurrence would be similar to Japan with a period of ten to 20 years of low growth. This is due to China’s financial system being largely closed off with the ability of financial authorities to control and restructure systemic liabilities before a significant drawdown can occur.
Perhaps the more optimistic and important thing to note is that China’s central authorities, especially the President, Xi Jinping, have recognized the need for change. In a recent speech on understanding China’s new development stage, linked here, he states:
“I noted that our economy was now in a slowing growth phase, a painful structural adjustment phase, and a phase of absorbing the adverse effects of previous stimulus policies. I emphasized that, at the same time, the world economy was also in a period of profound adjustment, which made for an extremely complex economic development environment. This required us to gain a proper understanding of the characteristics of the current stage of Chinese economic development and to undertake practical reforms and adjustments”.
It is a positive signal that Xi Jinping realized that economic growth could not be sustained at current levels nor via current methods. Even though growth will most likely come down from past highs, it can still be achieved through a different driver, such as demand instead of supply. It is also vital to recognize that the President does not face a political cycle making it a more streamlined process for him to implement painful but necessary reforms. However, the political situation will make it difficult and perhaps too constraining for China’s central authorities to implement change, forcing a vicious, self-reinforcing cycle of slow growth. It will most likely depend on Xi Jinping’s ability to implement structural reforms in a timely manner to avoid debts surging to unmanageable levels.
Conclusion
While China’s immense growth seen throughout the past few decades is certainly impressive, there is no denying that the country has developed some structural and cyclical headwinds. To create and sustain real growth in the long-term, China’s central authorities, especially the country’s President, have recognized the situation and are working to implement change. However, it will still be challenging due to the political and structural issues of implementing reform.
Note from Author:
Hi everyone, I apologize for the article’s length; there is just a lot to unpack regarding China’s economy. As always, I hope you enjoyed reading as I enjoyed writing! If you want to learn more, there is an excellent interview with Michael Pettis (whom I mention several times throughout the article), where he speaks on many of the things I discuss. I have included it here:

